A Surprising World Cup? Not So Fast...
Bravo les Bleus! For the final match, we gave 47% chances of winning to France, 25% chances to Croatia, and 21% chances of a draw after 90 minutes. But with the Croatian outsiders reaching the final after an epic journey, many report that this year’s edition was particularly surprising. We’ll see however that, quantitatively, this World Cup has been easier to predict in comparison to previous editions. We provide in this article an evaluation of our model’s performance and compare it to Google’s, FiveThirtyEight’s, and to predictions derived from betting odds.
Behind the scenes
Let us start by giving a few details about Kickoff.ai’s methodology. We model the probability of team A winning over team B or drawing as a function of the teams’ strengths. These strengths are learned using over 100 years of matches between national teams. However, football evolves very rapidly. Players come and go, their form varies from a day to another, and synergies within a squad are highly dependent on the selected players. We take these aspects into account as follows:
- We model team strength dynamically. Our model allows the strength of a team to change over time (check out France’s page on Kickoff.ai for an example). This enables us to reflect that recent confrontations should be more important to predict upcoming matches. We call this dynamic strength the Kickscore.
- We use Bayesian inference. This is a fancy way of saying that we are able to understand how confident we are about a particular prediction.
We also use two additional factors to boost or penalize a team’s Kickscore, because we found them to be improving the predictive accuracy on past editions of the World Cup.
- Home advantage. Teams playing in front of their crowd typically perform better. Even though there is no such home advantage during the World Cup, it helps learning the Kickscores more accurately using matches played at home (e.g., during qualification matches).
- Competition advantage. Teams sometimes perform differently during international competitions than we would expect given their strength. As the World Cup unfolds, our model learns this bonus (or malus) depending on how well (or bad) teams actually perform during the competition.
We also tried to model other aspects. We tried to add a host advantage to the team hosting the competition (i.e., Russia in 2018). We also tried to add a crowd advantage, i.e., a home advantage specific to each team. However, these factors were not helpful in increasing the predictive performance.
In summary, our predictions come from a combination of the Kickscore, and of home and competition advantages. The uncertainty in the data can be effectively quantified through the use of Bayesian inference. We retrain the model after every day to make sure that the most recent results are taken into account.
How well did our model perform?
Now that the World Cup is over, we can evaluate how well our model performed. It might be tempting to compare the accuracy of models by
- reducing the outcome probabilities to a single, most-likely outcome, and
- check how many times the predicted outcome was correct.
But this is rather crude, and loses a lot of meaningful information contained in these probabilities. Of course nobody could have reasonably predicted a German loss against South Korea. But just how much likely was this outcome? Was it 1%? Was it 5%? 20%? (Our model says it was 10%.) In a higly uncertain sport such as football, getting accurate estimates of the probability of such events to occur is very important.
Hence, we use a metric called logarithmic loss (or log loss). Informally, the log loss penalizes predictions that are both confident and wrong. It gives a number between 0 (the prediction was highly confidently correct) and infinity (the prediction was highly confidently wrong), so: the smaller the log loss, the better. In other words, this metric rewards predictors which are “least surprised” by the observed outcome, on average. We acknowledge that it is difficult to interpret the log loss in absolute terms. What does it mean for a model to achieve an log loss of, say, 1.315? The log loss is only meaningful in comparison to other models.
This year, many organisations provided forecasts prior to the World Cup. We kept track of the following ones:
- Google. When searching for a World Cup match on the Google search engine, an infobox would display predicted outcome probabilities. Unfortunately we don’t have details about the methodology that was used to generate these predictions.
- FiveThirtyEight, a popular American web site. Their methodology is well detailed. They have access to play-by-play data and can thus build a much more complex model, e.g., by considering each player in the lineup or by accounting for missed occasions during a match.
- Betting odds. We average the betting odds from many bookmakers and compute probabilities by inverting the odds. In a sense, the betting odds represent the collective intelligence of what people think about the outcome of a match.
- Random predictor. As a baseline, we also consider a “random” predictor that assigns a probability of 33.3% to every outcome: win, tie and loss.
As FiveThirtyEight did not provide probabilities for the tie outcome during the knockout phase, we consider the group stage (48 matches) and knockout stage (16 matches) separately.
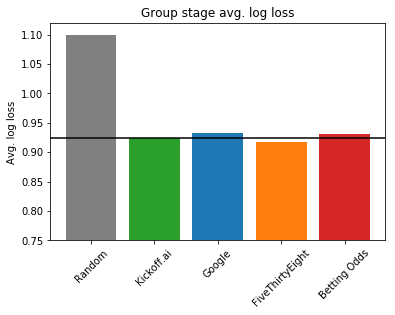 Group stage average log loss. Lower is better.
As we can see in the above plots, Kickoff.ai’s average log loss (0.925) is between Google’s (0.933) and FiveThirtyEight’s (0.918). It is also better than the betting odds (0.931). Given the complexity of FiveThirtyEight’s approach, the performance of our model is remarkable on the group stage.
Let’s dig into more details about how the performances evolved over time. We plot the cumulative average log loss, i.e. the log loss averaged match after match.
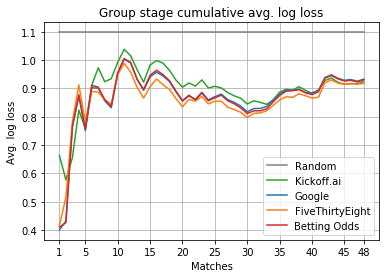 Group stage cumulative average log loss. Lower is better.
As we can see, Kickoff.ai’s model performs worse than competing approaches for about 30 matches, but catches up in the end, outperforming Google and the betting odds. In particular, the 7th match—Peru versus Denmark—costed us a lot. We were too confident that Peru would win (45%), when the other models were giving Denmark favorite (42%). Our model progressively reached back. First, with the 26th match—Serbia versus Switzerland—where we gave a Swiss win 47% chances to occur. Then, with the 32nd match—Uruguay versus Russia—where we correctly predicted Uruguay’s win with confidence (54%). On both matches, other models were more hesitating or wrong.
It is also interesting to observe how closely Google performance follows the betting odds. So close that it is legitimate to ask whether their model is not actually solely based on betting odds…
The results for the knockout stage are rather different. We show in the following figure the performances on the last 16 matches of the World Cup.
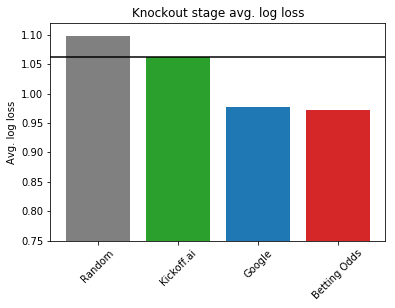 Knockout stage average log loss. Lower is better.
Here, we see that Kickoff.ai performed much worse than Google and the betting odds, with an average log loss of about 1.063 versus 0.978. And a glance at the cumulative average log loss shows that our predicted probabilities on the last six matches are not well calibrated.
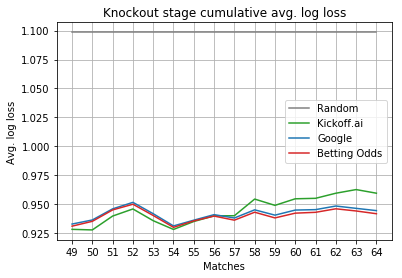 Knockout stage cumulative average log loss. Lower is better.
In particular, we made a big mistake in the 58th match, Brazil versus Belgium. We predicted a Brazilian victory with 57% chances and Google with only 46%. We also made a mistake on the third-place play-off, predicting England with 38% chances instead of Belgium.
A surprising World Cup? Not so fast…
The Croatian outsiders reached the final. According to our simulations prior to the World Cup, they had only slightly more than 6% chances to do so. Furthermore, Germany, the defending champion, has been eliminated from the group stage from the first time since 1938 by South Korea. England, after 28 years of hitting the quarter-final’s wall, qualified for the semi-final. France won the trophy with the youngest team since Pelé 1970’s Brazil.
All of this looks like a surprising World Cup. So we evaluated the performances of our model on previous editions. We show the results in the following figure.
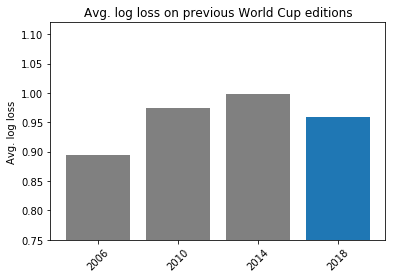 Average log loss on previous World Cup editions. Lower is better.
As you can see, our model’s performances during World Cup 2018’s edition are actually better than the previous two editions. This suggests that there were more surprises in 2010 and 2014 than this year.
What’s next?
The predictive performance of Kickoff.ai is competitive with more complex approaches. The competition bonus/malus per team helps to refine predictions over the course of the World Cup, even though the last matches proved to be difficult to predict. Besides, the Kickscores learned by the model provides interesting insights on teams performance over the years.
We are planning to release our predictions for club matches from European major leagues. We will continue tracking our performances and try to refine our model based the knowledge we gain.
Stay tuned by subscribing to our mailing list!!
Prediction data
Download the prediction data we used to evaluate the different models.