It's Coming... Rome
Forza Italia! We first wanted to congratulate the Italian team for an amazing Euro. They displayed some very attractive football and contributed to a competition with lots of emotions. They have also beaten the Kickoff.ai’s odds, as our Kickscore model gave a higher probability of winning to England: Italy had 30% chances to win, and England 39%. But does it mean we made a mistake?
How accurate are your predictions?
One question we’re often asked is “how accurate are your predictions?”. Our answer is usually unsatisfactory, because our model, almost by design, is bound to make errors. Arguably, no sane predictive model of football matches, Kickscore included, will ever predict a win for Czech Republic against the Netherlands, even though this was the outcome.
Football is a sport with a high level of randomness, in which one expects the unexpected. Yet, as shown in the plot below, Kickscore reaches an accuracy of 56.9%. This is (fortunately) better than if we were predicting all matches at random, in which case our performance would be 33%. We can also compute the accuracy obtained by the betting odds of some of the main bookmakers, which reaches 54.9%. Hence, although the accuracy of our model is much better than a random predictor and a bit better than that of the betting odds, it is still far from 100%.
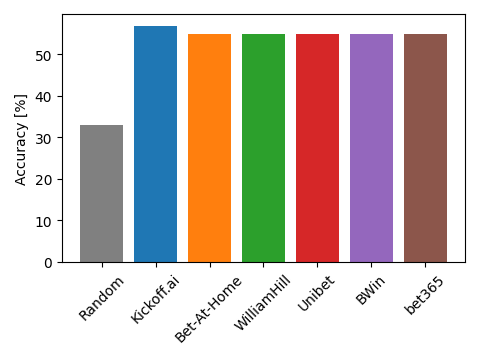 Accuracy obtained by Kickoff.ai and some of the major bookmakers. Higher is better.
All models are wrong, but some are useful
Predicting the outcome of a match is a difficult task - and one that is perhaps not the most useful and interesting. Football is a game of skill and luck, influenced by many factors and in which a part of randomness is always present. To take this uncertainty into account, statistical modelers and sports analysts design models that predict the probabilities of each outcome. A probabilistic model enables a more fine-grained analysis than a model that only predicts the outcome of a match, and provides a measure of how expected (or not) an outcome was. For example, probabilistic models, such as Kickscore, can be used for scouting new talents, for enriching media articles, for detecting fraud, and for setting betting odds.
However, even though probabilistic models provide many benefits, their major drawback lies in how to evaluate their predictions. The straightforward approach is to pick the outcome with the highest probability and decide that this is the model’s prediction. This is actually what we have done above to compute the accuracy. But, by doing so, we lose the crucial information contained in the probabilities, throwing the baby out with the bathwater!
Instead, to keep the probabilities intact, we must use other metrics, such as the Brier score and the logarithmic loss (referred to as the “log loss”). These metrics can be understood as penalizing predictions that are both confident and wrong. But interpreting them in absolute terms is difficult, and we have to compare the performance scores of several models in order to determine which one is the best. This is what we have done in our analysis of the World Cup 2018, where we compared Kickscore against the predictions of Google, FiveThirtyEight, and the bookmakers. For the Euro 2020, unfortunately, we can compare our performance only to that of the bookmakers, because Google and FiveThirtyEight didn’t provide predictions for this competition.
We choose to use the log loss to evaluate our performance (for reasons that are out of the scope of this blog post). The log loss is a value between 0 (highly confident and correct prediction) and infinity (highly confident and wrong prediction). Hence, a lower value is better. We show in the following figure the log loss for our model and for all bookmakers in our database. A random predictor that assigns a 33.33% probability to each outcome of each match reaches a log loss of 1.0986. The best log loss among the bookmakers is obtained by William Hill with 0.9829, and the best log loss overall is obtained by Kickoff.ai’s model with 0.9650.
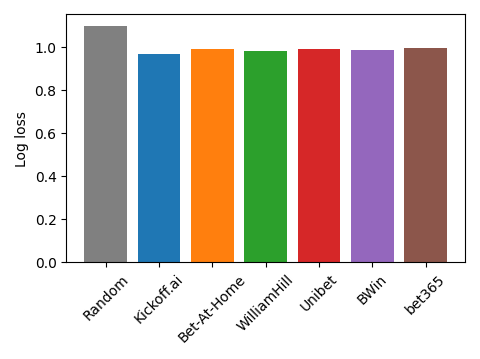 Log loss obtained by Kickoff.ai and some of the major bookmakers. Lower is better.
We don’t live in a simulation - or do we?
A second way of evaluating our probabilistic model is by simulating the whole tournament (before it happens) to predict the most likely winners. The predictions are obtained by simulating many times, say a 100,000 times, the matches of the Euro until the final, and computing the proportion of times a team wins the (simulated) competition. Once the competition is over, we can compare the models’ predictions with the true winner. We can then compare these predictions to that of other models.
This year, Goldman Sachs has provided such predictions using their own probabilistic model. Their model is different from ours because they model the number of goals scored by each team, whereas we model the outcome of a match directly. They could still simulate the Euro 2020 and they predicted the top-5 winners to be:
- Belgium (21.7%)
- Portugal (11.6%)
- England (10.9%)
- France (10.5%)
- Spain (10.2%)
Goldman Sachs analysts also provided the predictions of the winner obtained by the betting odds on Betfair. In this case, the top-5 winners are:
- England (20%)
- France (16%)
- Belgium (13%)
- Spain (12.5%)
- Germany/Italy (11%).
And for Kickscore, they are:
- England (17.1%)
- Italy (16.4%)
- Spain (12.1%)
- France (12%)
- Belgium (9.4%)
We see that Italy didn’t have the highest probability of winning for any of the three models. However, Italy had the second highest probability according to our model, and a probability less than one percentage point lower than that of England. England, on its parts, had the highest chances according to Betfair and to our model. Goldman Sachs predicted the highest probabilities of winning to Belgium and Portugal. Is it the influence of José Manuel Barroso, the former Prime Minister of Portugal who left his role as the President of the European Commission in Brussels to become chairman of Goldman Sachs? Who knows.
Will I become rich using Kickoff.ai’s predictions?
A third way of evaluating our predicted outcome probabilities is by using them to (try to) beat the betting odds. Since we didn’t (have the courage to) do that during the competition, we simulated what would have happened if we had. We use the Kelly strategy and implement it as follows to play against 10 bookmakers:
- Start with some amount of money M
- Compute the expected gain for each outcome as p(outcome) x odd(outcome)
- If there is a positive expected gain, bet fM on outcome, where f = expected_gain(outcome) / [odd(outcome) - 1] (this is the Kelly criterion)
We show in the plot below the evolution of our money when starting with M = $100. Our cash raised up to $276, but then decreased until $107, meaning that we would have made $7 if we started with an initial capital of $100 and followed this strategy. The matches Denmark–Finland and Poland–Slovakia would have given us the highest return ($50) by betting $6 on a win of Finland and $11 on a win by Slovakia, respectively. It is not clear why our money started to decrease after the match between Denmark and Belgium, but it was more difficult to predict the knockout stage (log loss of 1.1305) than the group stage (0.8961). This is similar to what we observed for the World Cup 2018.
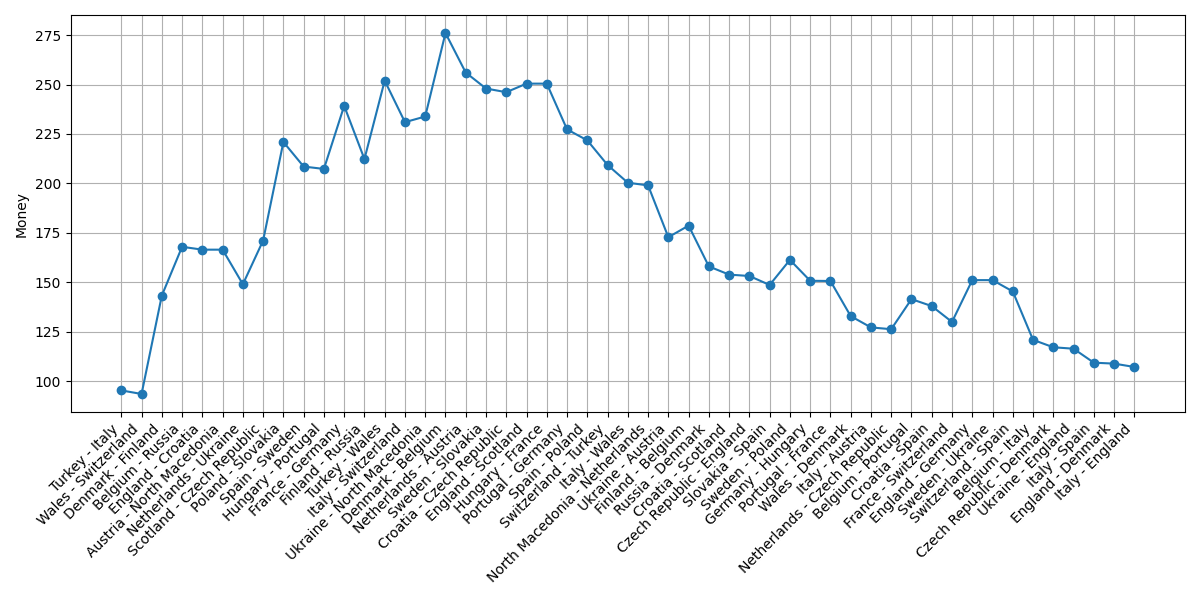 Simulation of betting using the Kelly strategy.
Conclusion
Despite all the complications due to the pandemics, it was a lot of fun to follow the Euro 2020. So many surprises, disappointments, goals, and emotions. And football came…to Rome! We are happy with how our model performed, since it performed better than the betting odds. It was also more accurate than the Goldman Sachs’s model at predicting the winner of the Euro. However, we would not have become rich by using our predictions for betting – this time at least.
Modeling football matches is as much an art as it is science. The possibilities are virtually infinite, and we have many ideas on how to improve our predictions. If you are interested in playing with our model as well, the code is publicly available on GitHub. We also have published an academic paper describing the mechanics of Kickscore.
Don’t hesitate to reach out to us if you have questions and to share your findings!